

2025 Austin Housing Market: What Team Price Real Estate’s DMI Data Reveals
Published | Posted by Dan Price
Understanding the Austin Real Estate Market Through Team Price Real Estate’s Demand Momentum Index in 2025
The Austin real estate market is always shifting, and one of the best ways to track those changes is through the Demand Momentum Index, or DMI, a proprietary tool created and updated daily by Team Price Real Estate at https://teamprice.com/market-performance/demand-momentum-index. This index measures how fast demand for homes—tracked by pending listings—grows compared to the supply of homes, shown through active listings, across six counties: Travis, Williamson, Bastrop, Hays, Caldwell, and Burnet. As of March 25, 2025, Team Price Real Estate reports the DMI at -47%, meaning supply is growing much faster than demand, creating a buyer’s market. Let’s explore this data, see how it’s changed over time, and look at what it might mean for the rest of the year.
The DMI, developed by Team Price Real Estate, acts like a market compass. When it climbs above 20%, demand outpaces supply, pointing to a seller’s market where homes sell quickly and prices often go up. When it falls below -20%, supply takes over, marking a buyer’s market where homes linger and buyers gain leverage. A DMI near zero shows a balanced market. Team Price Real Estate’s historical data shows big swings: in April 2021, the DMI hit 102%, reflecting a booming seller’s market during the pandemic. By January 2023, it dropped to -253%, signaling a huge oversupply after that boom faded. Today’s -47% fits into this history of ups and downs, giving us a clear picture of where the market stands.
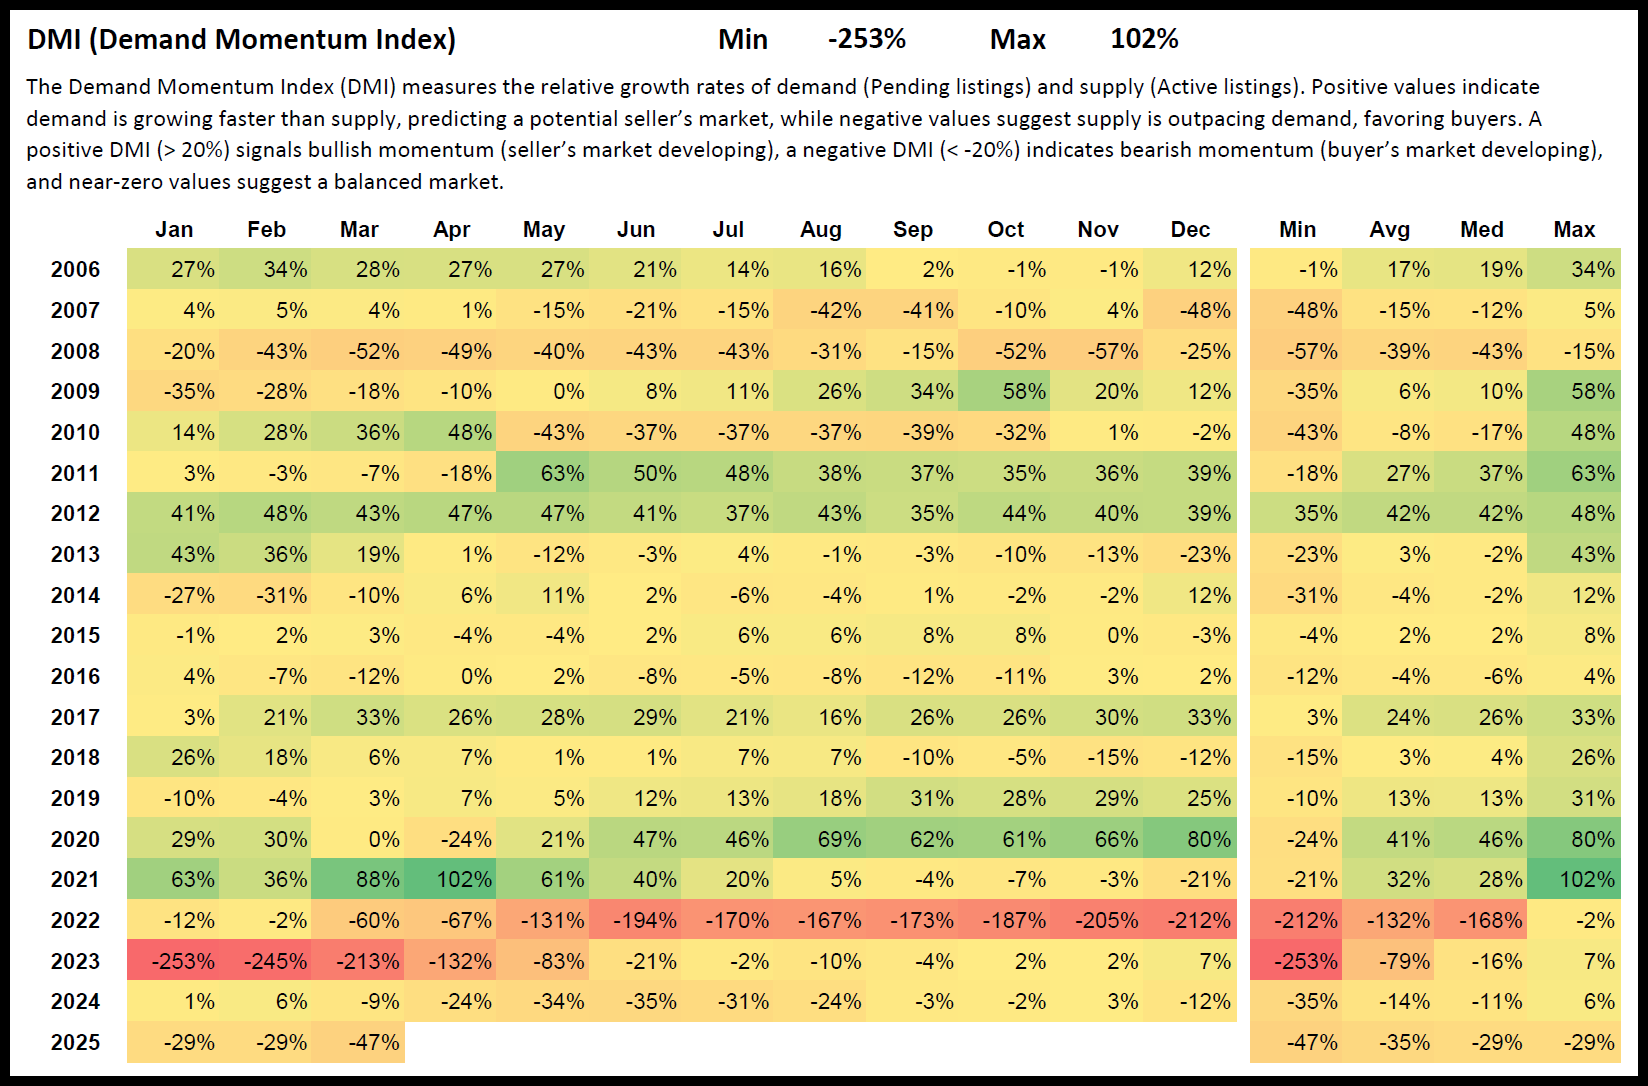
Looking at the numbers year by year, Team Price Real Estate’s daily updates tell us a lot. In 2024, the DMI started at 1% in January, rose to 6% in February, and fell to -9% in March—keeping things close to balanced. In 2025, it’s a different story: January and February both hit -29%, and March dropped to -47%. That’s a decline of 30 points from January 2024 to 2025, 35 points from February, and 38 points from March. This steady slide toward a buyer’s market shows supply growing faster than demand across the six counties, a trend Team Price Real Estate has been tracking closely.
A big piece of this puzzle is population change, especially in Travis County, the largest of the six counties. The U.S. Census Bureau reports that between July 2022 and July 2023, Travis County lost about 2,500 more people than it gained—the first net drop in 20 years. Lila Valencia, a demographer with the City of Austin, ties this to a slowdown in the tech industry, much like the 2002 dot-com crash. Since Travis County drives a lot of Austin’s housing demand, this loss weakens the market there. Meanwhile, surrounding counties like Williamson are growing, as Clare Losey from the Austin Board of Realtors points out. Team Price Real Estate’s DMI data shows this shift isn’t about people leaving the Austin area—it’s about movement within the region.
Team Price Real Estate’s data goes back to 2006, showing how the market has evolved. In 2006, the DMI averaged 17%, peaking at 34% in February, a solid seller’s market. By 2008, it averaged -39%, hitting -57% in December during the housing crash. It rebounded in 2012, averaging 42% with a high of 48% in February, and soared in 2021 to an average of 28% and a peak of 102% in April. Then came 2022 and 2023, with averages of -12% and -79%, and lows of -194% in June 2022 and -253% in January 2023. In 2024, it averaged -14%, and for the first three months of 2025, it’s at -35%. These numbers from Team Price Real Estate reveal a market that swings with economic tides.
What’s next for 2025? With the DMI at -47% in March, Team Price Real Estate’s data suggests the buyer’s market will stick around. After the -253% low in January 2023, it rose to -21% by June 2023, showing that big dips often ease up. Through June 2025, the DMI might stay between -20% and -40%, adjusting to higher supply and lower demand in Travis County. By late 2025, it could move toward -20% to 0% if demand grows in counties like Williamson, Bastrop, and Hays, following patterns in Team Price Real Estate’s records. Population shifts and economic factors like interest rates will play a role.
Over the years, Team Price Real Estate’s DMI data shows a market full of cycles. The 2017 seller’s market peaked at 33% in March, followed by a balanced 2018 averaging 4%. The 2020–2021 boom hit 80% and 102%, then flipped to -60% in March 2022. Now, the -47% in 2025 reflects Travis County’s population drop and surrounding counties’ rise.
Team Price Real Estate’s Demand Momentum Index, updated daily at https://teamprice.com/market-performance/demand-momentum-index, offers a clear view of the Austin real estate market. From 102% in 2021 to -47% in March 2025, it tracks how demand and supply move across Travis, Williamson, Bastrop, Hays, Caldwell, and Burnet counties. Travis County’s population decline since 2022 tips the scale toward buyers, but growth in surrounding counties keeps the region active. This proprietary data shows a market in motion, and Team Price Real Estate gives us the numbers to understand it.
Q1: Why is the Austin housing market slowing down in 2025?
A: The Austin housing market is slowing in 2025, with Team Price Real Estate’s Demand Momentum Index at -47% in March, per data updated daily at https://teamprice.com/market-performance/demand-momentum-index. This shows supply outpacing demand, driven by Travis County’s net loss of 2,500 residents between July 2022 and July 2023, linked to a tech slowdown, though growth in surrounding counties keeps some demand alive.
Q2: How does population change affect Austin’s real estate market?
A: Population changes shape Austin’s real estate market, as seen in Team Price Real Estate’s DMI data. Travis County’s loss of 2,500 residents from July 2022 to July 2023 reduces demand, pushing the DMI to -47% in March 2025. Growth in counties like Williamson increases demand there, balancing some of the region’s decline, per daily updates at https://teamprice.com/market-performance/demand-momentum-index.
Q3: What is the Demand Momentum Index, and how does it predict Austin’s housing trends?
A: The Demand Momentum Index (DMI) is a proprietary tool from Team Price Real Estate, updated daily at https://teamprice.com/market-performance/demand-momentum-index. It compares demand (pending listings) to supply (active listings). Above 20% signals a seller’s market, below -20% a buyer’s market. At -47% in March 2025, it predicts a buyer’s market across six counties, based on Team Price Real Estate’s data.
Request Info
Have a question about this article or want to learn more?
